Thursday, December 10, 2015

How fast can my gliding speed increase?

Well, you would think I was an ice skate racer, but instead I am a simple little cart on a simple table.

Like I said, I am only a little cart  trying to figure out how fast I can accelerate. So my proud renter took me, and put me on a track, measured every half second, and then took data to see first my change in position over time, which lead to velocity, and then solved for acceleration. 

This looked like the initial chart of:


This gave us the following graph. Note the curve upward.


We had to take the following formula, y=mx+b, and change it into a line that more closely resembles the formula's we are dealing with. The following formula is x=slope*t^2+xo. When you notice that the t is squared, it is because the time must be squared to fit into a graph to solve for acceleration.
This produced the following graph:


Note the slope of 0.070747.
In order to solve for Acceleration, we use the formula V=1/2a
Thus, as our slope is velocity, we can multiply it by 2 and solve for the acceleration. 
Our acceleration is 0.070747*2=0.141494. 

However, when we checked it with the motion detector, it found .22 as the slope. I do not know why, but will continue to ponder why I (the cart) am not accelerating at the indicated pace.


Wednesday, December 9, 2015

CAPM A summary of learning

Welcome to my new readers, and hello to the old.

CAPM stands for Constant Acceleration Particle Models, wherein we built from our former understanding to develop a knowledge and appreciation of what constant acceleration means.

This added acceleration graphs to our chart in contrast with velocity, showing how they intermingled. Then we worked on how we could translate from a motion graph, to a velocity graph, and then to one for acceleration. 

CAPM.1

Instantaneous velocity:

This is the velocity at any precise, given, point in time. It can be calculated in several ways from either charts or graphs. If at a graph, one can tell the velocity by using exactly where it is on a v vs t graph, such as the one below that is both constant velocity and constant acceleration.
http://www.thetrc.org/pda_content/texasphysics/e-BookData/Images/SB/57/LR/ConstAccelConstVelComparisons.png

Thus, by finding the exact position of an object which is its data points on a v vs t graph, we can see what the exact instantaneous velocity is. 

The second way to solve  for velocity is by taking mirroring in time data points on both sides of what you are looking for, and then inputting them into the formula V= Change in position/ Change in time.
Capm.2
Solving for displacement can be solved for either with formula's or with a graph. 
The formula is Change in x= xfinal-Xinitial on a x vs t graph, however on a velocity vs time graph the formula becomes change in x= 1/2*a(change in t)^2+ Vi(total time)
On a graph, we can use the position vs time graph to see where it is by subtracting the initial data points from the final coordinates.
Capm.3 
Solving for acceleration can be done in four ways.
The first is looking at a velocity vs time graph, where we can input our data into the formula a=Change in v/ change in t.
The second is solving for it in other formula's, such as solving for a in the following formula Change in x= 1/2 a (change in t)^2 + Vit.
The third is simply looking at an acceleration vs time graph and seeing where it is. 
The fourth is solving for it in the second formula:
Vf=a(change in time)+V(initial)
CAPM.4


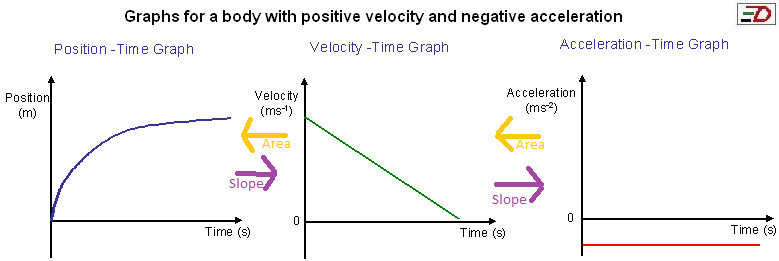
If you look at the following position vs time graph, you may note:


Picture
This is taken from http://gradeelevenphysics.weebly.com/speed-velocity-and-acceleration.html


 You may note that it is constantly decreasing its velocity, however the acceleration is constant. It is travelling in a positive direction though the velocity and acceleration are negative as it is slowing down. 

The corresponding v vs t graph would resemble the one above, with it constantly decreasing. The acceleration is steady but nonetheless negative as it is slowing.
CAPM.5

If we take the same graph as above, we can draw a position vs time graph based on our initial understanding of what the motion means. Because our velocity vs time graph is starting positive, and never becomes negative, we know that our position vs time graph will be positive. We also know that initially it will be going faster, as our velocity graph starts from a higher position on the y (Velocity) axis. Then, as our velocity slopes downward, we know that our position vs time graph line needs to lessen its upward motion, gradually curving out until it is almost going straight.

Due to the constant nature of our velocity going towards the x (time) axis, we know that it is heading in a negative direction and thus our acceleration will be negative and a straight line.

CAPM.6

In order to construct a graph, we must see that there are 4 particles. 

The 4 particles are:

What direction is it going?

Is it constant?

What variables are we given, and what do they apply to? 

Is it possible for it to become negative?

From this, we can draw any graph we wish. 


CAPM.7
To solve for time, we can take the average formula x=1/2 a(t^2)+Vi(total time).
From this, we can solve using algebra to isolate our t. 
Please note the image below to see the process. 


Monday, December 7, 2015

Weight Challenge

Good day,
Today in Physics, we were asked to solve a challenge for a mystery weight suspended by two cords which provided the tension.
The diagram was similar to the one below:
This resulted in the use of our formula SohCahToa.
Sin= opposite/hypotenuse
Cos=adjacent/hypotenuse
Tan=opposite/ adjacent

This resulted in a diagram resembling the one below:


The corresponding free body diagram resembles the one below:


The calculations to accompany this diagram are:

Ft1y + Ft2y= Fg  

Sin( beta)= Opp/Hypotenuse
Sin38=Ft1y/ 0.9
0.9n*sin(38)=Ft1y
Ft1y= 0.5540953277934n

Sin( beta)= Opp/Hypotenuse
sin (70)= Ft2y/2.2n
2.2n*sin(70)=Ft2y
Ft2y= 2.0673237657292n

Due to Ft1y + Ft2y= Fg 
Then, 0.5540953277934n+2.0673237657292n=Fg

Thus, Fg=2.6214190935226n


Thursday, December 3, 2015

Hello,
To my Dearly appreciated Readers,

May I wish you a wonderful day amidst the chaos of the year.

Now, on to the point of my blog, let me address the concept of today. This post will discuss free body diagrams, as well as the parts that make them up.

Concept 1: Force diagrams (AKA Free body Diagrams AKA FBD's)

What are force diagrams?

Well, they are the diagrams that explain how the forces (such as tension, gravity, pull, push, and friction) interact with objects on our planet. A free body diagram is composed of multiple parts. The central part is a dot or circle, which represents the item that forces are acting upon, and only that one item.
Please note the example below:
Image taken from: wikipedia
The f weight in this example ends up actually being Fg in all that we do, however it does show us what a free body diagram looks like for an object sitting at a table


 On our planet, the force of gravity is labeled as g= 9.81 (or less precisely 10).

Concept 2: newton's 1st law.

There are three laws that govern forces as we know it  so far, but we have only covered 2. These laws are Newton's 1st law, and Newton's 3rd law.

Newton's 1st law is that "An object at rest stays at rest and an object in motion stays in motion with the same speed and in the same direction unless acted upon by an unbalanced force." (physics classroom.)

This means that any object such as a ball, a bike, anything really wants to do what it is currently doing. This means that any object moving will stay moving but any object that is not moving (at rest) will stay at rest. The only exception is if an outside (aka unbalanced) force acts upon it which means that something affects it such as pushing or pulling, blowing, moving it, etc...

This applies to life in that a ball won't move unless you touch or kick it, a ball won't fly through the air unless you throw it. 

In fact , a ball flying through the air is only affected by one force the whole time, that is the force of gravity. From the start of the throw the ball goes through 3 stages, going up, being perfectly in the middle, and coming down but no matter what the only aspect that matters is that gravity is the only thing acting on it. 
Thus the free body diagram is:


In another example, a skydiver is also only affected by gravity until they open their parachute up. In the first few seconds, the speed of the man is steady, but once they open their parachute, their descent slows  as the air resistance of the parachute starts to try and counter-balance gravity. Thus we see the chronicle of events, with first their initial jump from the plane, then when they have just opened their parachute but it is not fully expanded, to when it has slowed their descent considerably but not halted it.


All objects on the earth, at rest, or experiencing constant velocity have balanced forces. The FBD for at rest and at constant velocity look the same. They are shown below. 


Concept 3. 
The relationship between mass and weight (g=9.81n/ kg but we tend to use 10 for basic problems).

Weight in Newtons is the result of mass times the force of gravity. This is depicted in the formula:
w=mg.

We tend to use 10 for the force of gravity, but the exact number allowed is 9.81. Mass is only taken in kg thus any weight in grams must be multiplied by .01 to then become in kilograms which we can convert to newtons.

Thus if an object has a mass 2.5 kg, we can solve for weight by inserting the mass into our formula (w=mg) as w=10*2.5 or alternatively w=2.5*10.
Thus weight equals 25 newtons for the object.


Concept 4. Friction force and normal force on objects.
Friction force is the force that stops us from endlessly accelerating from one single push, as it helps slow us down. Normal force is what is counter to gravity, stopping us from sinking straight into the earth.

Friction is affected by surface material and weight, surface area doesn't matter.


Concept 5. Here is an example of a balanced force diagram. The umbrella is perched atop the bike and weighs 40 newtons. The bike weighs 200 newtons. The action reaction pairs are:
found via google images, umbrella on bike.

The umbrella 

Umbrella pulls bike up.
Bike pulls umbrella down.

Bike pulls earth up.
Earth pulls bike down.


The formula for an action reaction pair is:
Object 1 exerts force on object 2 in a direction.
Object 2 exerts equal force on object 1 in opposite direction.


Wednesday, November 18, 2015

Velocity vs Time

Good Afternoon Readers,


In our most recent challenge, we were solving for the acceleration of a ball (or any object) at 4 seconds.
In order to do this, we first took our measurements for 0 seconds to 3 seconds every half second.

Thus our first table looked like this:

Which made the graph:

In order to find acceleration, we squared the time in order to form a linear line. This resulted in a graph resembling:


This graph is based on the following data:


As seen in the velocity vs time graph, our velocity is 11.52 cm/s^2 which in meters is .1152m/s^2

As The formula for velocity is v=1/2a
Thus we know that a= 2v
This means that a=2* (.1152)
A=.2304

When we tested our experiment, our data was that acceleration was .235 thus the percentage of difference is 1.01, meaning that we were within the 10 percent.


Monday, October 19, 2015

Texting While driving


                                            Texting While Driving

Purpose:

  In this lab, we intend to examine the amount of ground we would cover when texting LOL to a friend.

Diagram:


In this experiment, our independent variable was time, and our dependent variable was texting model and word chosen. 

We attempted to control the testing model by only having one person (Owner of this blog) use the phone, and running through the whole process on the same phone, a samsung galaxy S6. We recorded from the time of initial pickup, to all the way until the send button was hit starting from the home screen every time.

We ran five trials which were:


As the result, we calculated that it took us 10.454 seconds to text LOL to a friend. We had decided that we were going 40 miles per hour, which means that we covered 211200 feet in an hour. This means that every minute, we cover (211200/60) 3520 feet in a minute. As there are 60 seconds in a minute, we can further calculate that we covered (3520/60) 58.7 feet per second.

Due to it taking us an average of 10.454 seconds to text LOL to a friend while driving at 40 miles per hour, we can calculate that in that time frame, we covered approximately (10.454*58.7) 613.6 feet when we texted LOL to a friend. 


Model 1 of physics
Hello New Readers and those who have come back,

In this post I am going to be talking about Velocity, Displacement, Speed, Distance, Velocity Maps, Motion Maps, and Position Maps.
Velocity is change in X over time, which applies to the total distance over time covered in real life. This means that if someone were to walk 20 miles there, and 20 miles back over the course of 2 hours, their velocity would be 0mph even though they covered 40 miles.


Speed in this scenario,  would be 20 miles per hour , as speed takes into account the distance covered  continually over time which is 40/2.

Displacement is the change in x by the formula:
 x= x final - x starting point.
This means that if I start walking along the valley, and walk down the hill, then back up to my initial position, my displacement is zero as my starting and ending points were the same, thus I have no displacement. 

Velocity maps show how fast an object is going over seconds (or predetermined time intervals) and also shows direction. When a velocity map has a positive slope, it is going north of the original y axis interaction point, when the slope is negative, it has changed direction and is going southward.
Taken from: http://www.physicsclassroom.com/Class/1DKin/U1L4b5.gif

In this graph, we can see that the object starts at 0, but then has a velocity of 40 m/s for 1 second, before slowing to a pace of 20 m/s for 3 seconds, thus covering 60 m in 3 seconds. At the 4 second mark, the object changes direction and goes south at a velocity of 20 m/s for 10 seconds. The final velocity of the whole trip is (displacement/ time), thus (100m/14s) which is approximately -7.14 m/s. The total displacement in the above scenario is 100 meters.

In the world we live in, google maps uses displacement to give you an estimate of how far you will have to go, but really it is the total distance covered once you start the map that your estimate is based on once you actually hit the navigate button which is distance.

Velocity is the average of the displacement between your starting point and finishing point over the time it took you to make the journey. The formula based off displacement could resemble ((x=x final- x initial)/time)=velocity.

Speed is what your speedometer shows you at any given time, only taking into account how much ground is being covered (example: Miles), over the time (Example: hours), thus speed can be portrayed as miles per hour (mph).

Motion maps are useful in that they align with velocity over time maps, as well as position over time maps to give you a complete picture. They indicate where something is at a measured interval of time. So in the one below, we can see that for the first 3 seconds it covers a certain distance ( let us use 3 meters in this case), then for then the two upward dots indicate that it rests in place for 2 seconds, then based on the presumption that the amount of ground previously covered was 3 meters in 3 seconds, we can now see that it has accelerated as it covers 3 meters in 2 seconds. This comes down to a final velocity of 1.5 meters per second, and a displacement of 0, though a distance covered of 6 meters.
Image taken from: http://harker-physics.wikispaces.com/file/view/GRAPH%202.jpg/461507878/246x260/GRAPH%202.jpg
Position over time map

Position over time maps can be used to find the velocity as well as draw a motion map based off of them. They tell you where an object is at any given point in time, which gives us the slope. The slope is the velocity for the object at that point in time.

Image taken from: http://www.algebralab.org/img/3e38cd8d-b44f-4bb6-b4ad-152ea360ffd3.gif
So in this image we can tell that for the first 2 seconds it does not move, before changing direction and going south at 1 meter per second for 3 seconds, before it changes direction and speeds up going 3meters per second for 2 seconds before it comes to a rest.

Sample problems of this:


If an object starts at the origin, and is moving at 8 m/s for 5 seconds, then how changes direction and goes -3m/s for 5 seconds, how far has he gone in total?
25 meters.


Wednesday, September 30, 2015

Model 1 of physics

Hello New Readers and those who have come back,

In this post I am going to be talking about Velocity, Displacement, Speed, Distance, Velocity Maps, Motion Maps, and Position Maps.

Velocity is change in X over time, which applies to the total distance over time covered in real life. This means that if someone were to walk 20 miles there, and 20 miles back over the course of 2 hours, their velocity would be 0mph even though they covered 40 miles.


Speed in this scenario,  would be 20 miles per hour , as speed takes into account the distance covered  continually over time which is 40/2.

Displacement is the change in x by the formula:
 x= x final - x starting point.
This means that if I start walking along the valley, and walk down the hill, then back up to my initial position, my displacement is zero as my starting and ending points were the same, thus I have no displacement. 

Velocity maps show how fast an object is going over seconds (or predetermined time intervals) and also shows direction. When a velocity map has a positive slope, it is going north of the original y axis interaction point, when the slope is negative, it has changed direction and is going southward.
Taken from: http://www.physicsclassroom.com/Class/1DKin/U1L4b5.gif

In this graph, we can see that the object starts at 0, but then has a velocity of 40 m/s for 1 second, before slowing to a pace of 20 m/s for 3 seconds, thus covering 60 m in 3 seconds. At the 4 second mark, the object changes direction and goes south at a velocity of 20 m/s for 10 seconds. The final velocity of the whole trip is (displacement/ time), thus (100m/14s) which is approximately -7.14 m/s. The total displacement in the above scenario is 100 meters.


In the world we live in, google maps uses displacement to give you an estimate of how far you will have to go, but really it is the total distance covered once you start the map that your estimate is based on once you actually hit the navigate button which is distance.

Velocity is the average of the displacement between your starting point and finishing point over the time it took you to make the journey. The formula based off displacement could resemble ((x=x final- x initial)/time)=velocity.

Speed is what your speedometer shows you at any given time, only taking into account how much ground is being covered (example: Miles), over the time (Example: hours), thus speed can be portrayed as miles per hour (mph).

Motion maps are useful in that they align with velocity over time maps, as well as position over time maps to give you a complete picture. They indicate where something is at a measured interval of time. So in the one below, we can see that for the first 3 seconds it covers a certain distance ( let us use 3 meters in this case), then for then the two upward dots indicate that it rests in place for 2 seconds, then based on the presumption that the amount of ground previously covered was 3 meters in 3 seconds, we can now see that it has accelerated as it covers 3 meters in 2 seconds. This comes down to a final velocity of 1.5 meters per second, and a displacement of 0, though a distance covered of 6 meters.
Image taken from: http://harker-physics.wikispaces.com/file/view/GRAPH%202.jpg/461507878/246x260/GRAPH%202.jpg
Position over time map

Position over time maps can be used to find the velocity as well as draw a motion map based off of them. They tell you where an object is at any given point in time, which gives us the slope. The slope is the velocity for the object at that point in time.


Image taken from: http://www.algebralab.org/img/3e38cd8d-b44f-4bb6-b4ad-152ea360ffd3.gif
So in this image we can tell that for the first 2 seconds it does not move, before changing direction and going south at 1 meter per second for 3 seconds, before it changes direction and speeds up going 3meters per second for 2 seconds before it comes to a rest.